
The 2011 census recorded 20,616 people living in the area covered by the Neighbourhood Planning Forum. 10,605 of these were boys or men, and 10,011 girls or women. Most of this descrepancy is accounted for by 514 male prisoners in Durham Jail. (The prison has a capacity of 1,0171 but only 514 of them have been recorded in the census statistics.)
Over half (53%) of the residents were students, who numbered 10,916. A few of these would be sixth-formers who had attained the age of 18, but the vast majority are at Durham University or New College. The resident population of 9,700 has roughly the same age balance as for the rest of County Durham, except 11% are aged 75 or over as opposed to 8% in the County as a whole. 33% of the permanent residents are retired (25% in the County), and only 3% are sick or disabled (7%).
Detailed spreadsheets are available in both OpenOffice and Excel formats. These show statistics for ten sub-areas – see maps below.
1 Operational capacity: 1017 as of 8th March 2011, see the Ministry of Justice web page of Durham Prison Information. Census Customer services advise that prisoners on remand or serving a sentence of less than six months would be recorded at their home address.
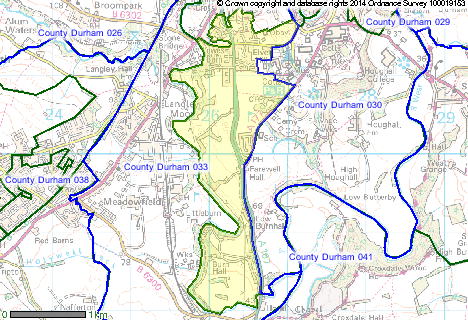
Maps of sub-areas
(These are not all to the same scale)
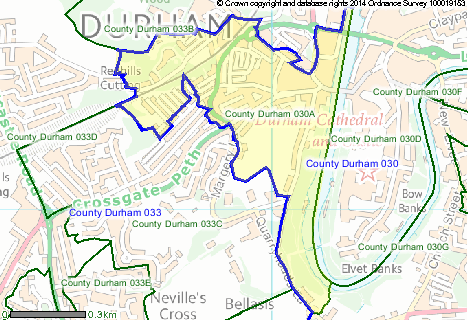
Area 030A

Area 030D
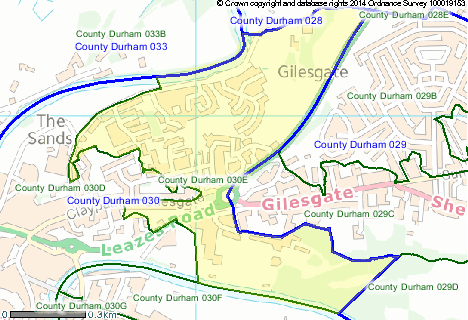
Area 030E

Area 030F
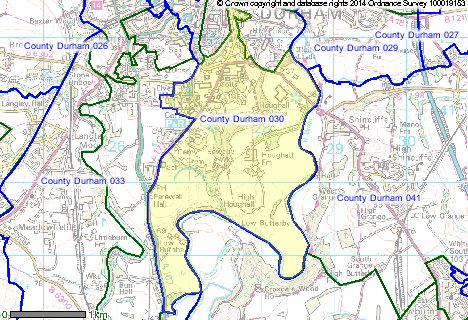
Area 030G
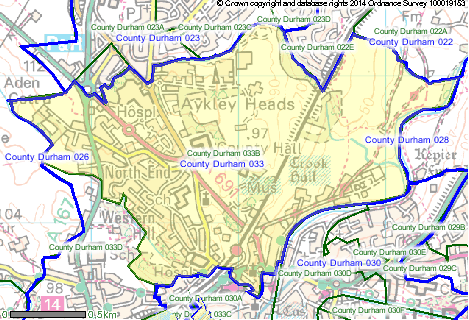
Area 033B
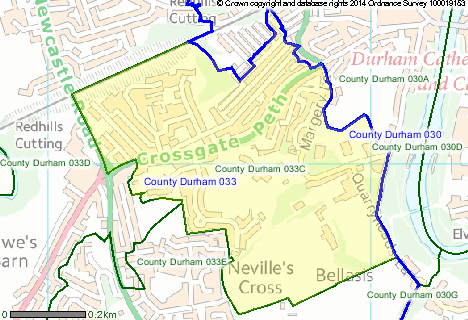
Area 033C
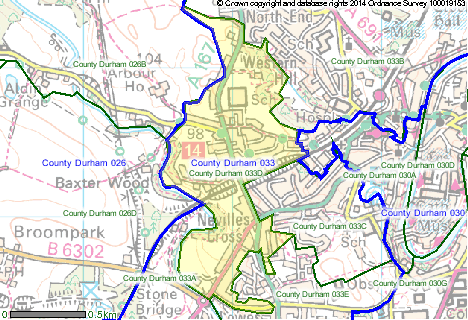
Area 033D
Area 033E
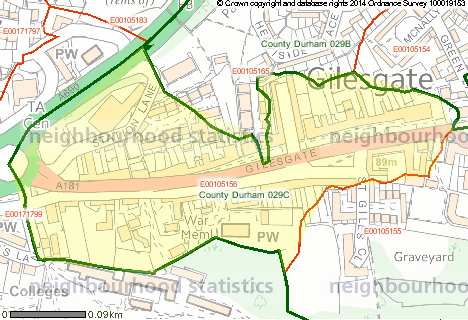
Area E00105156