D.2 Many of the transport characteristics of Our Neighbourhood stem from the constraints posed by the River Wear as it cuts through the landscape, and by the hilly terrain which has necessitated various engineering solutions to ease transport by road and rail. While modern footbridges such as Pennyferry Bridge, Kingsgate Bridge, Baths Bridge and Maiden Castle Bridge help to connect neighbourhoods, the transport network is largely limited and defined by the flood-plains and bridges of the River Wear, and the historic approaches to the city. The A167 bypasses Durham City centre on the west (though this road now passes through built up areas) and the A1(M) passes Durham beyond the eastern boundary of Our Neighbourhood. The east-west route through the City is the A690. Some routes, such as those to the west and south-east via Crossgate Peth and Shincliffe Peth are still constrained to an extent by the cuttings created to ease the passage of vehicles over the hills of the outer bowl in which the city is set.
D.3 The Durham City Traffic Survey 2015 (JACOBS, 2016) found that around 33% of vehicular traffic trips passed through Durham City and 47,000 vehicles cross Milburngate bridge every day; only 5% of vehicular trips were made wholly within the City centre. Most of the traffic is to and from locations within County Durham but there were also journeys to and from Sunderland, Newcastle and Gateshead. Using 2011 Census travel to work data (Office for National Statistics, 2011; collated via DataShine Commute) we can total commuting journeys originating in the area and those starting outside with the work destination being in the area to get a picture of travel patterns. The majority of journeys are by car (77%), with 11% on foot, 10% by bus, 1% by bicycle and 1% by train. If we look just at journeys to work which both start and end in the area, 60% are on foot, 32% by car, 4% by bus and 4% by bicycle.
![]()
D.4 The chart is coloured to show work journeys to the area, within, and starting from the area, and demonstrates the importance of the area for employment, as far more people travel into Our Neighbourhood to work than live here and travel elsewhere. The chart also shows the modal share, as summarised above in paragraph D.3.
D.5 Data from the University annual travel surveys (Durham University, 2013a,b, 2014) provide a useful picture of trends, as well as information on the potential for changing travel mode and the barriers to doing so. From the latest figures we were given for the Durham campus, staff travel to the University in 2014 was 76% by car, 9% on foot, 9% by bus, 4% by bicycle and 2% by train. Student travel in 2013 was 82% on foot, 5% by car, 6% by bus, 5% by bicycle, 2% by train. The Review of Durham University’s Sustainable Travel Plan Targets 2008-2016 (Durham University, 2017b) shows small fluctuations in modal share over the period but no discernible long-term shift.
D.6 Our Neighbourhood is quite compact, which makes it a walkable environment. Most of the built-up area can be reached in 30 minutes from the market place, and there is an extensive network of footpaths sometimes providing short-cuts by comparison with footways alongside roads. On the other hand, the steeper routes and steps can be difficult to negotiate for those with mobility issues, and there are many deficiencies such as narrow, badly-lit or poorly maintained routes, making walking less attractive. Some pavements are heavily congested during the University terms. Severance of pedestrian routes by the A690 and other major roads is also an issue, but walking is very much encouraged in the historic core of the city, with pedestrian areas on Silver Street and Elvet Bridge, and the congestion charge limiting vehicular access to Saddler Street and the rest of the peninsula.
D.7 Most of the built-up area of Our Neighbourhood can be reached from the Market Place by bicycle in 15 to 20 minutes. There is little dedicated provision for cycling aside from a few routes sharing pedestrian footways. The Durham City Sustainable Transport Delivery Plan (Durham County Council, 2018b, p.22) notes that cycling levels in Durham City are low for a compact university town. Durham University (2013a) 2013 staff travel survey asked respondents what would encourage them to cycle to work: 54% said nothing would encourage them to cycle, but 22% could be encouraged with cycleway improvements or traffic-free routes.
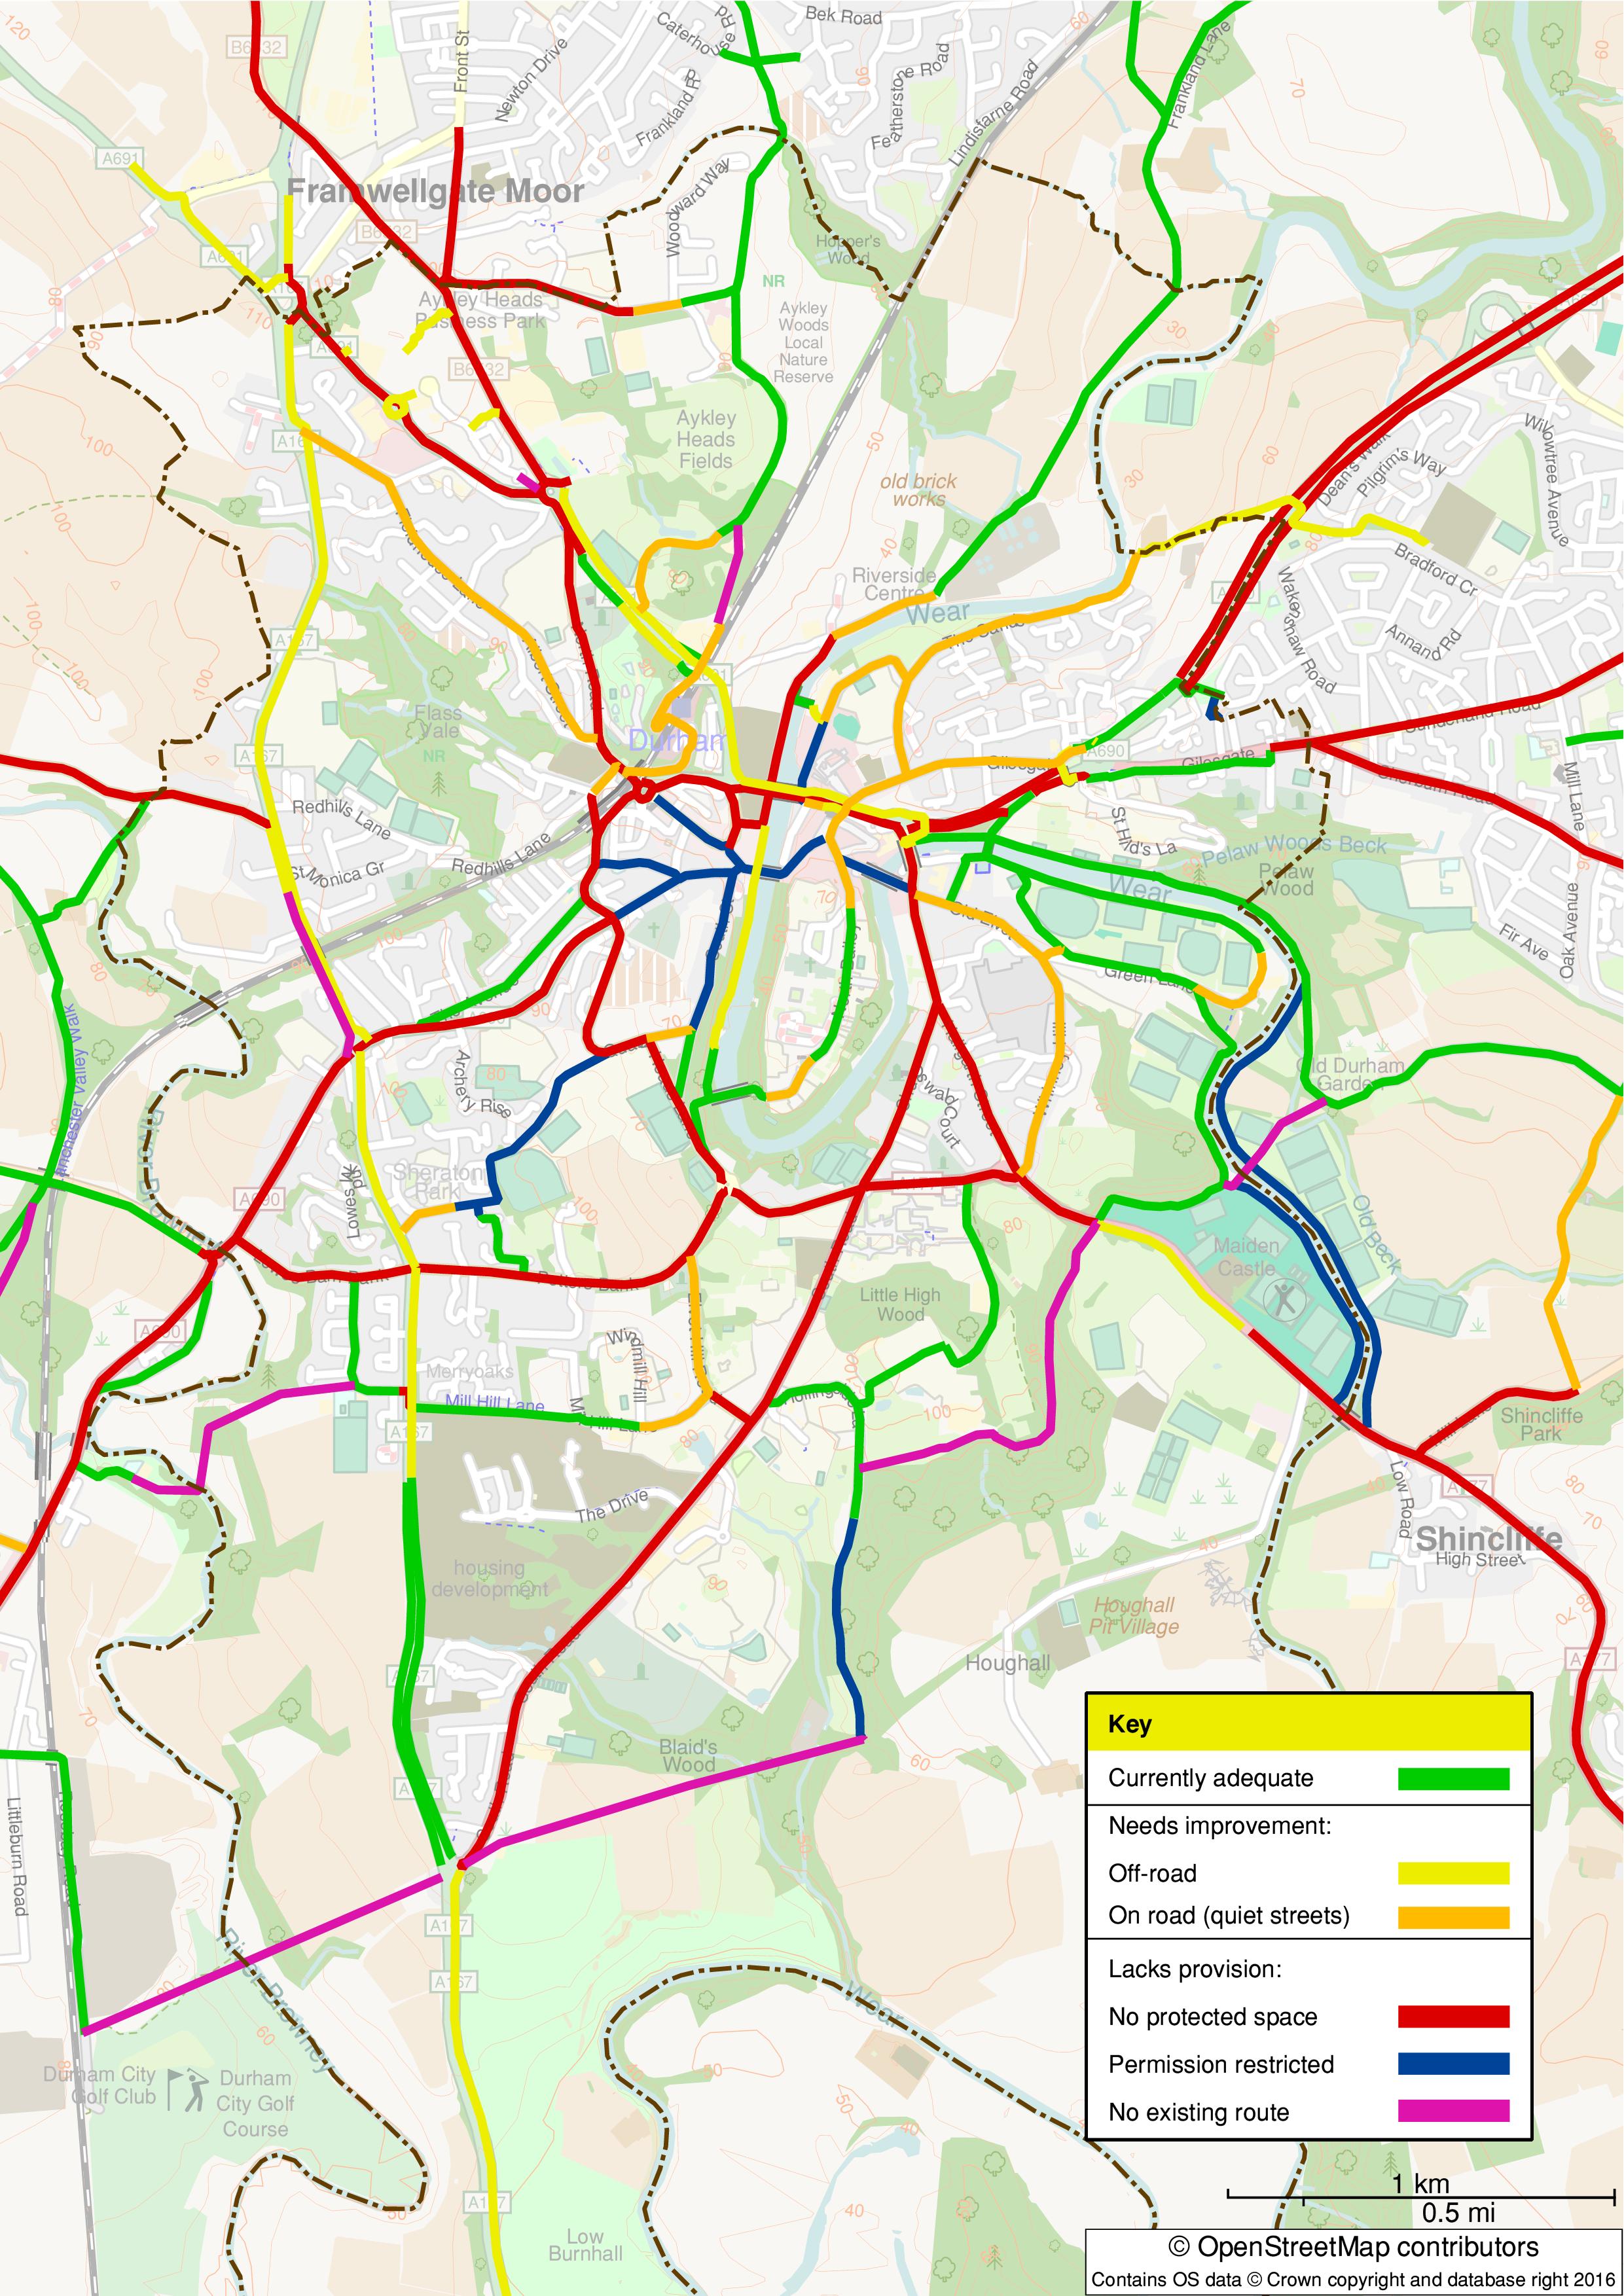
D.8 As part of the preparation of the Neighbourhood Plan, the concerns of local people regarding the walking and cycling environments were gathered through two consultation events. The findings were used as the basis for two maps, which were included in the Consultation Draft. These have been refined following the Regulation 14 consultation and are included here as Maps 9 and 10. The maps represent a snapshot of the situation at the time of publication. Full background information is available in the Walking and Cycling Evidence Paper (Durham City Neighbourhood Plan Working Party, 2019b). See paragraph 4.249 for how the evidence is to be used in support of Policy T1.
Map 8: Pedestrian Issues

Map 9: Cycling Issues
D.9 Bus routes from Durham reach all the main towns in the county and adjoining centres although many are infrequent and limited to daytime only. Although there are some express services, most call at a number of villages on the way and so commuting to or from places such as Sunderland and Middlesbrough is generally much faster by car. Buses from central Durham serve most of the employment and education sites around the City, but the lack of through services means that commuting by bus is less attractive, and the timekeeping can be affected by peak time traffic congestion as there are few bus priority measures. There are two main bus companies but no interoperability of tickets.
D.10 Durham railway station had over 2.5 million entries and exits in 2015/16 (Office of Rail and Road, 2016) and a 2012 study found that 45% of journeys were between Durham and Newcastle (Durham County Council, 2015b, p.52). Journeys by train can be made throughout the UK, but locally only Newcastle and Darlington are well-served owing to the closure of most railway lines in the county. Other major destinations such as Sunderland, Stockton and Middlesbrough are much easier to reach by road than by rail, as is the airport at Durham/Tees Valley. Newcastle Airport is readily accessible from central Durham by using the train and Metro. Reopening the Leamside line is an aspiration which would increase the local journey opportunities.
D.11 The Durham Sustainable Transport Plan Issues and Opportunities Report (Durham County Council, 2015b) found that the cost of car parking in Our Neighbourhood is comparatively cheaper than other small historic cities in England. There were 1,700 off-street spaces, 70% of which are privately owned: Prince Bishops with 400 spaces, the Gates with 204 spaces, Walkergate 500 spaces and the railway station 358 spaces. The council controlled off-street provision amounts to 262 spaces (Durham County Council. Durham City car parks), and in addition there is controlled parking on many residential streets. Car parking is also found at the large employers in the City: County Hall has 900 free spaces; University Hospital has 245 spaces which are charged; New College has 850 free spaces (outside Our Neighbourhood); the Arnison retail centre (outside Our Neighbourhood) has 1,400 free spaces; Durham University has 2,600 spaces which are free but require a permit; Aykley Heads has 280 spaces and charges £2.00 per day and the Riverside centre has 170 free spaces. The recently developed Passport Office and National Savings Office deliberately have no spaces for employees.
D.12 Park and Ride facilities have been developed on the northern, western and southern approaches to the City centre and operate Monday to Saturday from 7.00 am to 7.00 pm, but currently require subsidy from the County Council. In 2015 they catered for 1.1 million passengers with 1157 spaces (Durham County Council, 2015b, p.50). There is no provision for coach parking in Durham City following the recent development of the Sands for the new County Hall offices. Coaches now park adjacent to the Belmont Park and Ride car park which is out of Our Neighbourhood. There are 5 taxi ranks (in North Road, the Railway station, Claypath slip road to Leazes Road, and slip road by Prince Bishops car park) and 2 car clubs.
See also: Table D1, Table D2, Table D3, Table D4
Next section: References to the Evidence Base